
Visualize, Analyse, Optimize: My Experience at the Webinar
What happens when you bring together a passionate community of learners, an industry expert, and a hands-on approach to data analytics? You get an insightful session that leaves everyone excited to dive deeper into the world of Power BI! That’s exactly what happened in our Power BI webinar, led by Soomal Fatima, organized by Wajeeha Jalal, and co-hosted by Marium Salman.
This session wasn’t just about learning a tool; it was about understanding how to turn raw data into meaningful insights and present it in a compelling way. From data transformation and visualization techniques to real-world application tips, we covered it all!
Power BI: More Than Just a Tool
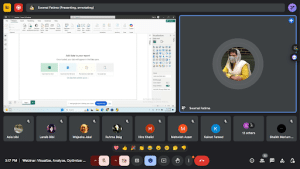
Soomal Fatima started with a quick introduction to Power BI, explaining why it has become a go-to tool for businesses and data analysts. She walked us through importing, transforming, and visualizing data using different elements like charts, tables, and cards.
💡 “Can we screen-share while working on Power BI?” asked one of the attendees.
Soomal’s response: Absolutely! Power BI allows live collaboration, making it easy to work with teams and present insights effectively.
Making Data Come Alive
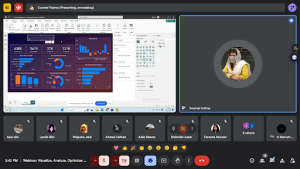
One of the best parts of the session was the hands-on approach—we weren’t just listening, we were watching the magic happen in real-time. Soomal demonstrated how to use different visualization techniques and highlighted the importance of choosing the right chart for the right data.
Pro tip: The right visualization can make or break your report. Understand your data before selecting a chart type!
- Interactive session moment: Ahmad Hafeez suggested using ribbons and measures for enhanced reporting, and Soomal acknowledged and explored the idea, making the session truly collaborative!
Do You Really Need Certifications?
Certifications are always a hot topic in tech. Many attendees wanted to know: Are certifications necessary to land a job in data analytics?
Soomal’s take: Certifications can help, but they are not the ultimate key to success. Employers look for practical experience—real-world projects matter more than a certificate on your resume. Build, practice, and showcase your skills!
At IEC, we push students to build projects and gain practical experience to succeed in their live. You can enrol in our program!
Final Thoughts & Key Takeaways
The session ended with a valuable discussion on how to keep improving in Power BI. Here are some golden takeaways:
- Experiment & Explore: The best way to learn Power BI is by working on real datasets.
- Keep It Simple: Overloading dashboards with too much information can make insights harder to understand.
- Certifications Are a Plus, Not a Must: Focus on practical application over just collecting certificates.
- Ask Questions & Stay Curious: The more you interact, the better you understand!
As the webinar wrapped up, I couldn’t help but feel motivated to dive deeper into Power BI and make data storytelling a part of my skillset. If you ever get the chance to attend a session like this, don’t miss it!
Until next time, keep analyzing, keep visualizing, and keep optimizing!
She is a Content Creator at IEC with expertise in content creation and graphic design. She is passionate about storytelling, creativity, and crafting impactful digital content.